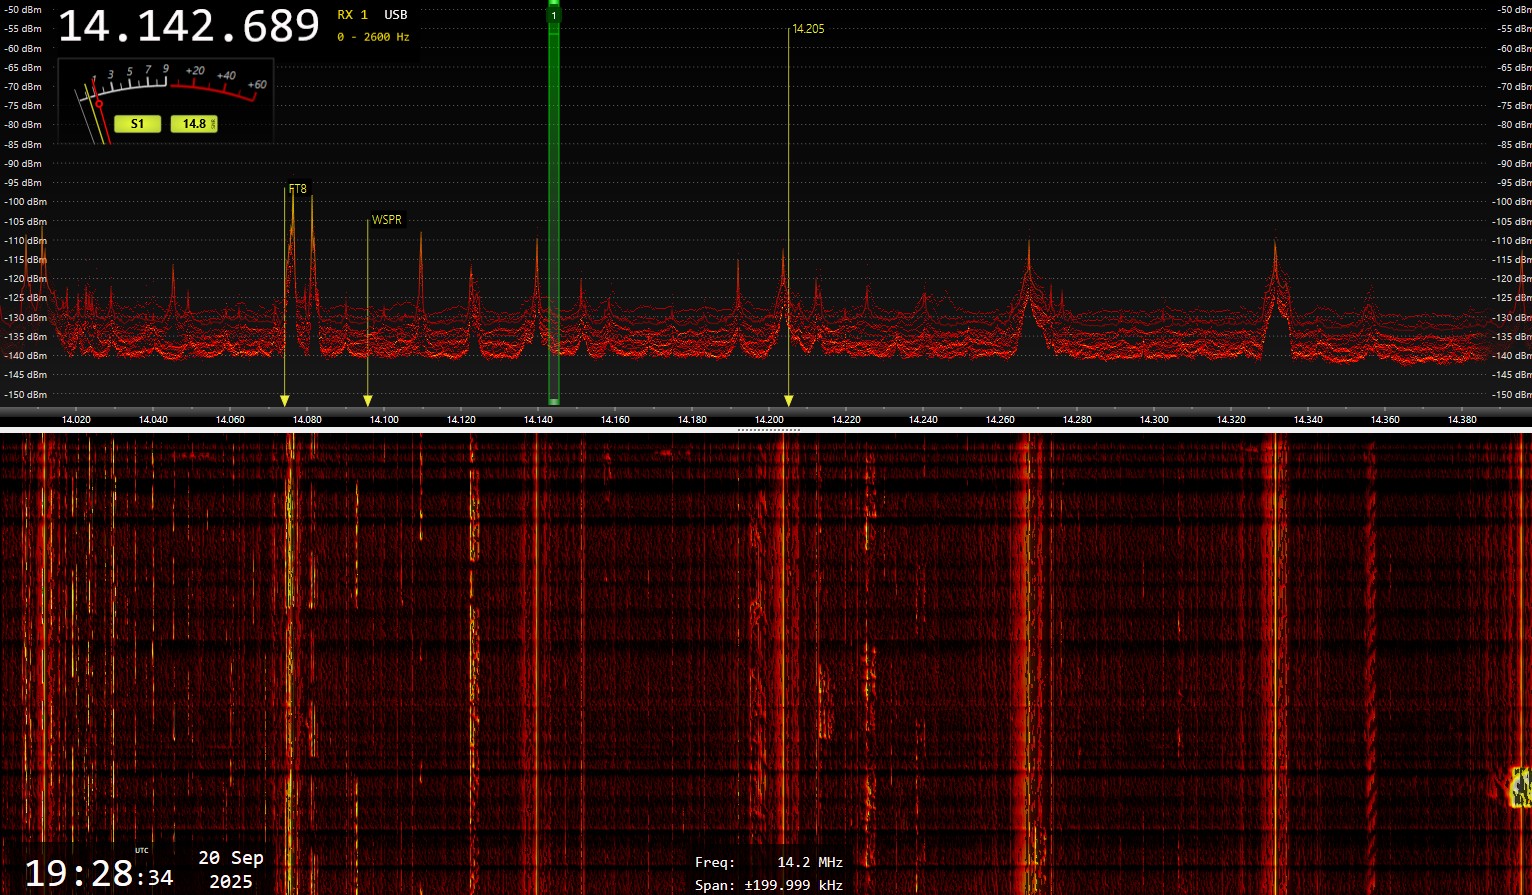
Each morning at Carters Beach, shortly after sunrise, the 20m amateur band enters a curious phase: the noise floor fluctuates dramatically, often dropping by as much as 10 dB sometime 15 dB. The effect lasts between 60 and 90 minutes, with a start time that consistently aligns with the Sun reaching approximately 6 to 8° elevation. This correlation suggests a strong link to solar geometry rather than classic greyline enhancement.
The pattern primarily affects DX signals and the noise floor, while local signals within ~2,500 km remain relatively stable. This points to ionospheric refraction instability, particularly in the F-layer. As the Sun climbs, the ionosphere transitions from night-mode to day-mode: the D-layer begins forming, absorbing lower HF signals, while the F-layer is still stabilizing. This reconfiguration creates unstable refraction paths, leading to rapid fading, multipath interference, and amplitude flutter — especially for long-path signals.
While most pronounced on 20m, similar post-sunrise flutter effects have been observed on 40m and 80m, though at a much lower intensity. These bands, being less reliant on high-angle F-layer refraction, show more subdued variations — yet still reflect the broader ionospheric transition underway.
While the post-sunrise flutter is the most consistent and pronounced, similar effects have been observed at other times of day. These sporadic episodes show that the ionosphere responds not only to solar elevation but also to short fluctuations in solar radiation intensity — including UV and X-ray flux. The result is a living, reactive medium where even subtle changes in solar output can ripple through HF propagation in unexpected ways.
For operators and propagation watchers, this daily flutter window offers a rich opportunity to observe the living dynamics of the ionosphere. It’s not a fault — it’s a feature. And like all good features, it deserves to be understood, archived, and shared.


