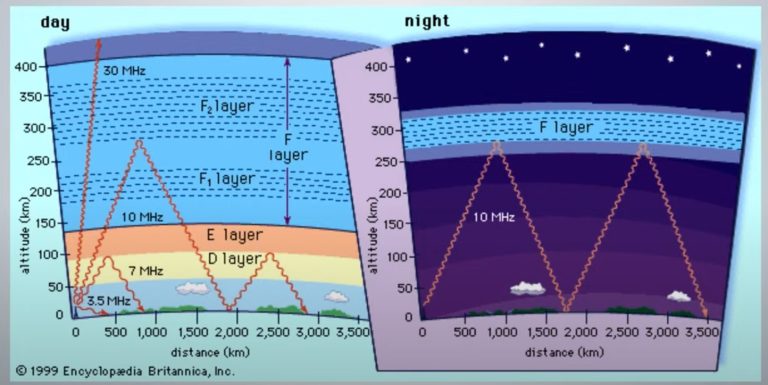
Imagine an invisible, electronic fog that softly hugs the surface of the Earth—a wispy, ever-changing veil that is both delicate and profound. This ion mist is layered like the subtle stratification of natural fog, its density and form shifting with the changes in sunlight. Constantly absorbing and refracting radio waves, it plays a dual role: at times a gentle filter that guides and shapes signals, and at other moments, a dynamic barrier that bends or diffuses them in unexpected ways. Signals that can reach the far side of our planet in well under 1/10th of a second. Far from the towering heights often depicted in textbooks, this electronic fog exists much closer to us—an intricate, transient phenomenon that underscores the ever-evolving relationship between our technology and the natural world. This fog is called the ionosphere.
Ionosphere Misconceptions
There’s a persistent idea among many hams that draws the ionosphere as being thousands of kilometers high—a notion largely perpetuated by simplified diagrams that stretch the vertical scale to make skip propagation paths easier to visualize. While these illustrations are undoubtedly useful for understanding how radio waves can “bounce” off layers in the upper atmosphere, they also tend to obscure the true scale of the ionosphere relative to the Earth.
Graphical Clarity vs. Physical Reality
Many textbooks and online diagrams inflate the altitude of the ionospheric layers for the sake of clarity. This creative license helps illustrate how radio signals travel: bouncing off a layer and curving back toward the Earth after that single hop or “skip.” In reality, the effective refractive layer—often the F region—is generally found somewhere between 250 and 400 kilometers above the Earth during most propagation conditions. Compared to the Earth’s diameter of roughly 12,700 kilometers, even several hundred kilometers is a very short distance. In other words, while the drawings might suggest a dramatically tall barrier, the ionosphere is, in relative terms, quite close to the Earth’s surface.


Understanding the Scale
Consider this perspective:
When you compare these distances, it’s clear that the ionosphere is less than 5% of the Earth’s diameter. The graphical models are designed to help you understand signal paths more intuitively, but they aren’t meant to be literal depictions of scale.
Why the Misconception Persists
The misrepresentation persists because a visually striking diagram can be very memorable. New hams, and many older ones, especially those who have mainly learned from simplified sketches, may come to believe that the physics of skip propagation necessitate an ionospheric “mirror” that is much farther away than it truly is. In fact, the ionosphere is a complex, dynamic medium located in the upper atmosphere—it does extend far above the ground if you consider rarified particles, but the effective layers used for reflecting HF signals are relatively low when seen in the context of our planet’s overall scale.
Conclusion
The goal isn’t to diminish the value of illustrations used in training—but rather to ensure that they’re interpreted with an understanding of their limitations. By grounding HF propagation in scientific data and a realistic sense of scale, we can help foster a more accurate and nuanced view of our ionosphere. This understanding is crucial for the next generation of hams, who can then exploit the true nature of HF propagation to achieve better and more enjoyable, reliable communication.